AI Bubble Diagram Maker: The Smart Way to Visualize Ideas
In today’s fast-paced digital world, organizing ideas clearly and visually has become more important than ever. Whether you’re planning a project, brainstorming for a presentation, or mapping out complex data, visual diagrams can turn confusion into clarity. That’s where an AI bubble diagram maker comes in — a powerful tool that transforms simple ideas into structured, professional-looking visuals within seconds.
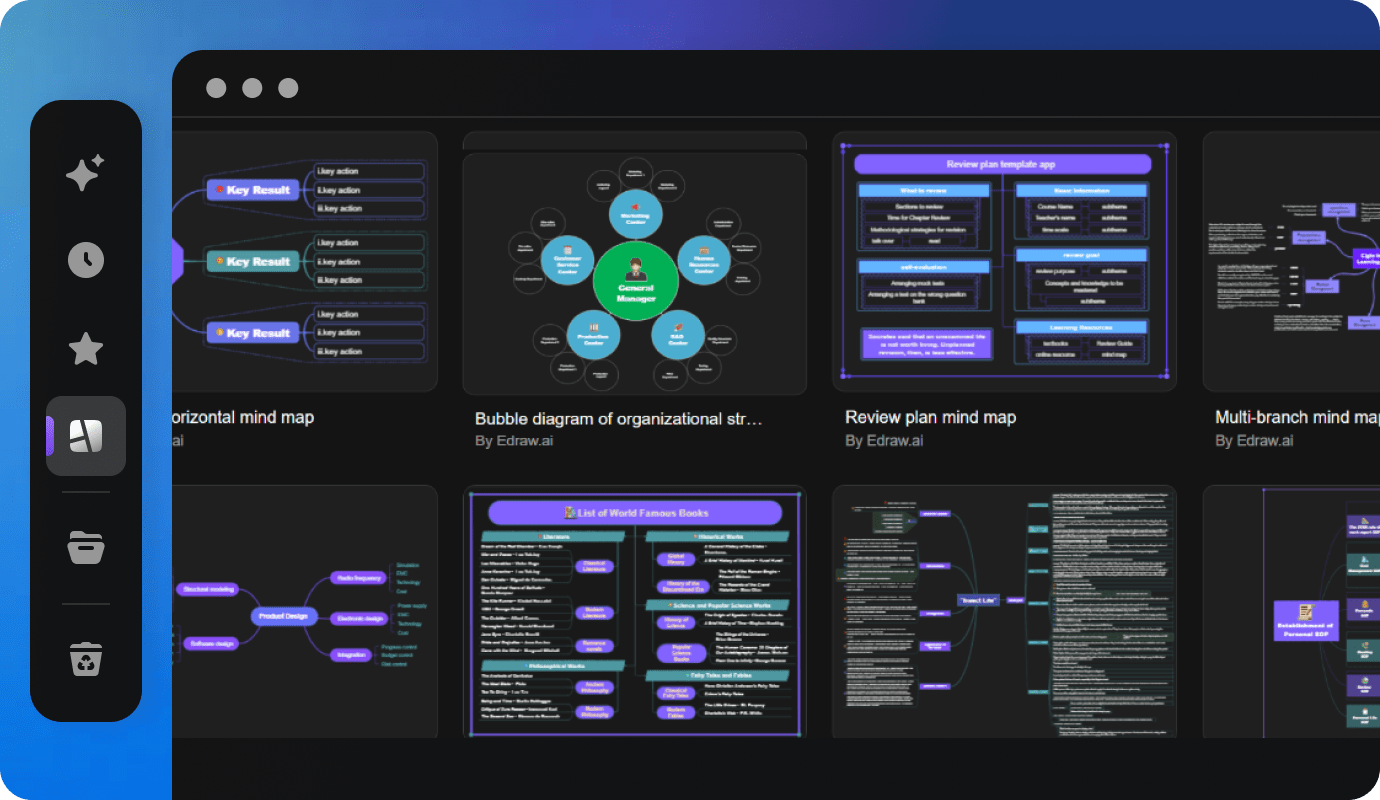
This article explores everything you need to know about AI bubble diagram makers — how they work, their features, benefits, and how they’re changing the way individuals and businesses visualize information.
What Is an AI Bubble Diagram Maker?
An AI bubble diagram maker is an intelligent tool that helps you create bubble or circle diagrams using artificial intelligence. These diagrams display relationships between concepts through connected circles or “bubbles.”
Traditionally, creating a bubble diagram meant manually drawing circles, connecting them, and labeling ideas. But with AI-powered tools, this process is automated. You simply enter your main idea or keywords, and the AI generates a complete diagram that visually represents your concept map.
In short, it’s like having a digital assistant that turns your thoughts into an organized visual flow.
Why Use an AI Bubble Diagram Maker?
AI bubble diagram makers are becoming popular across industries — from education to business strategy. Here’s why:
Saves Time and Effort
Creating diagrams manually can be time-consuming. AI tools automate the process, producing clear, balanced layouts in seconds. You focus on ideas, not drawing.
Boosts Creativity
When you see your ideas visually, new connections and insights often emerge. The AI can suggest related concepts or reorganize your layout to inspire creative thinking.
Improves Understanding and Communication
A bubble diagram simplifies complex information. For students, it helps in learning and memory retention. For professionals, it aids in presentations, reports, and planning sessions.
Ensures Neat and Professional Layouts
AI-generated diagrams maintain perfect symmetry, spacing, and clarity. Even non-designers can produce visuals that look ready for publication or client presentations.
Supports Collaboration
Most AI diagram makers include real-time sharing and editing features. Teams can brainstorm together, edit ideas, and visualize workflows from anywhere.
Key Features of an AI Bubble Diagram Maker
Modern AI-powered diagram tools offer advanced capabilities beyond just placing circles. Here are the most valuable features to look for:
AI-Powered Auto Layout
You can input text, and the AI automatically arranges bubbles in a clean, logical pattern — no manual dragging needed.
Smart Connections
AI identifies relationships between ideas and draws connecting lines automatically, showing hierarchy and flow.
Customizable Designs
Change colors, bubble sizes, text fonts, and themes to match your brand or presentation style.
Data Integration
Some tools allow importing CSV or spreadsheet data to automatically generate diagrams.
Collaboration Tools
Work together with team members in real time. Add comments, edit content, and update diagrams live.
Export and Sharing Options
Save your diagram as a PNG, PDF, SVG, or PowerPoint file to include it in documents, slides, or reports.
AI Suggestions
AI can recommend related concepts, categories, or clusters based on your input, helping expand your ideas further.
How AI Bubble Diagram Makers Work
The process of creating a bubble diagram with AI is simple and intuitive.
Here’s how it usually works:
Input Your Main Idea:
Type your core topic or concept, such as “Digital Marketing Strategy.”
Add Supporting Ideas or Keywords:
Enter related ideas — like SEO, social media, email marketing, and analytics.
AI Generates the Layout:
The tool automatically places your ideas into bubbles, connecting them in a logical way.
Customize the Design:
Adjust colors, sizes, and fonts to make it visually appealing.
Export or Share:
Download your diagram or share it directly with your team.
This process takes less than a minute and results in a polished diagram ready for professional use.
Use Cases of AI Bubble Diagram Makers
AI bubble diagram tools are versatile and can be used across many fields. Here are some practical examples:
Education
Teachers and students use bubble diagrams to explain concepts, brainstorm ideas, or outline essays. For instance, a student could map out a history lesson on “Causes of World War II” with main and supporting factors visually connected.
Business and Project Management
Teams use AI diagrams to plan projects, outline workflows, and visualize goals. It helps in strategy meetings, product development, and business process mapping.
Marketing and Branding
Marketers can create visual mind maps for campaigns, brand positioning, or audience segmentation. It’s a great way to brainstorm creative content ideas.
UX/UI Design
Designers use bubble diagrams to map user journeys or organize content hierarchies before creating interfaces.
Research and Data Organization
Researchers can quickly structure their literature reviews or research frameworks visually for clarity and better presentation.
Top Benefits of Using AI Bubble Diagram Makers
Let’s look deeper into why these tools are game changers:
Enhanced Productivity
AI handles repetitive design work, freeing up more time for analysis, creativity, and execution.
Better Team Collaboration
With real-time editing and cloud storage, team members can collaborate without confusion. Everyone sees updates instantly.
Clarity in Communication
Visuals are easier to understand than long text blocks. Bubble diagrams make presentations and reports more engaging.
Accessibility
You don’t need to be a designer to use these tools. AI makes it accessible for anyone — from students to executives.
Scalability
AI diagram makers can handle small idea maps or large, complex systems — all with consistent accuracy.
AI Bubble Diagram Maker vs Traditional Diagram Tools
| Feature | AI Bubble Diagram Maker | Traditional Diagram Tools |
|---|---|---|
| Speed | Instant automatic generation | Manual and time-consuming |
| Ease of Use | Beginner-friendly | Requires design experience |
| Layout Quality | Perfectly balanced and clean | Often uneven or cluttered |
| Collaboration | Real-time and cloud-based | Usually offline or limited |
| Customization | AI + manual design options | Fully manual customization |
| Smart Suggestions | AI recommends related ideas | None |
Clearly, AI-powered tools offer significant advantages in both speed and efficiency.
Who Can Benefit from an AI Bubble Diagram Maker?
AI bubble diagram makers aren’t just for designers or professionals. They benefit anyone who needs to visualize information:
Students: For brainstorming essays, summarizing lessons, or creating study notes.
Teachers: For lesson planning and visual teaching aids.
Business Professionals: For planning projects, meetings, and strategies.
Marketers: For visualizing campaigns and brand structures.
Researchers: For mapping out topics, relationships, or findings.
Designers: For outlining user journeys and app flow structures.
Tips for Making the Most of an AI Bubble Diagram Maker
To get the best results from your AI diagram tool, keep these tips in mind:
Start with a Clear Central Idea
Define your main topic before adding subtopics.
Use Short, Clear Phrases
Avoid long sentences. Keep text concise for readability.
Color-Code Ideas
Use color variations to group similar concepts or categories.
Review AI Suggestions
Don’t accept everything automatically — refine to fit your goals.
Keep It Simple
Avoid overcrowding your diagram. Focus on key relationships and main ideas.
Export and Share Strategically
Use different export formats (PDF, PNG, PPT) based on where you’ll use the diagram.
The Future of AI Bubble Diagram Makers
AI diagram tools are evolving rapidly. Future versions may include:
Voice-to-Diagram Creation: Speak your ideas, and the AI converts them into visuals.
Data Visualization Integration: Automatic transformation of data tables into bubble diagrams.
AI Collaboration Assistants: AI that suggests next steps or related diagrams based on team discussions.
3D Visualization: Interactive, 3D bubble maps for complex systems or data visualization.
As AI continues to advance, diagram creation will become even more intuitive and automated, making visual communication an everyday skill.
Common Mistakes to Avoid
Even with AI assistance, there are a few pitfalls to watch out for:
Overloading the Diagram: Too many bubbles can confuse the viewer.
Ignoring Hierarchy: Make sure your main ideas stand out clearly.
Using Inconsistent Colors: Maintain color harmony for professional visuals.
Not Reviewing AI Output: Always double-check the accuracy of AI-generated connections.
By avoiding these mistakes, you’ll create diagrams that are both clear and visually appealing.
Conclusion: Transform Ideas into Visuals with AI Bubble Diagram Makers
In a world overflowing with information, visual communication is key. An AI bubble diagram maker simplifies the process of turning abstract thoughts into structured, easy-to-understand visuals. Whether you’re a student, teacher, manager, or marketer, these tools help you brainstorm, plan, and present ideas with clarity and confidence.
The best part? You don’t need design skills — just your ideas. The AI takes care of the rest.
So, if you’re ready to enhance your productivity, creativity, and communication, try an AI bubble diagram maker today and experience how effortlessly your ideas can come to life.


Post Comment